Traffic II: Why does the Fast Lane become Slowest in Traffic?
Contents
As I drive up to San Francisco from one of the freeways (either 101 or 280), I’m approaching the inevitable traffic stoppage. The freeway is clogged and it seems I’m up for 15 minutes in bumper-to-bumper traffic, wishing I had a self-driving car.
But wait, what is it? Why am I stopped and everyone else keeps going? Could it be just another example of the Why is the Other Lane Always Faster? illusion?
Series on Car Traffic modeling
Inspired by my almost daily commute on California Highway 101, I explored the achievements of traffic theory and found answers to the most pressing mysteries of my commute.
Casual, repeated observations confidently refuted this. The traffic always gets stuck in exactly the same manner all the time. The leftmost lane’s blockage starts farthest; then the second-to-the-left lane, and the rightmost lanes are always fastest. How come?
The conclusion it seems, does not require deep understanding of traffic theory: more cars arrive through fast lanes than through the slow lanes; more cars means more congestion. But traffic theory can help put mathematical notation around it so read on.
Fundamental properties of traffic: Flow, Density, Speed
My observations suggested that a model of traffic that can explain this phenomenon requires to detach the speed of the traffic from its other propertie such as amount of cars per square unit of higheway. I later learned that traffic theory has been exploring these questions since like 1930s (here’s an overview of classical traffic flow models on Wikipedia), so I’ll put my observations in these accepted terms.
If you observe a section of a lane of the freeway for some time, as enough cars pass, you’ll notice that traffic has some numerical properties.
-
The amount of cars passing through a certain point per unit of time, what traffic engineers call flow. Let’s measure it in cars per minute, and name it
q. -
The average speed with which cars move, or
v. -
The average amount of cars that are simultaneously within the segment boundaries at any given point of time, referred to as density, or
k.
We’ll talk more about these in the section on traffic models, but for now we’ll just use them to discuss the question of the day.
Why does the fastest lane have the longest congestion?
Let’s assume a typical highway in the San Francisco Bay Area that’s moving cars without congestion:
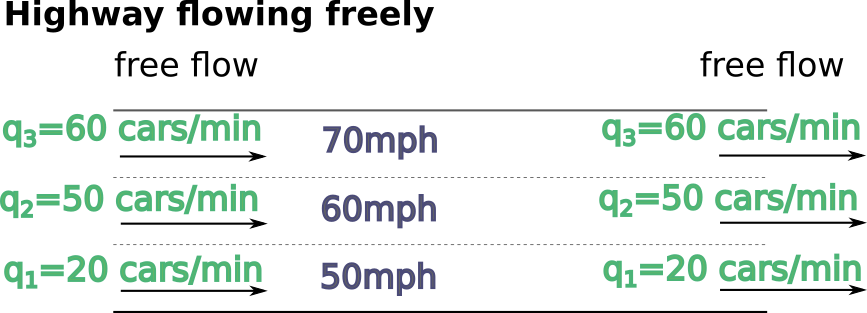
The speed limit on Californian freeways is 65 mph (~105 km/h). So when slow trucks drive in the slow right lane, few other cars want to share the lane with them. That means that the slow lane has disproportionately small flow.
So while I didn’t conduct scientific research on these values of q, they seem entirely explainable within
the traffic model and agree with casual observation.
We know that the Fast Lane (the left lane)‘s speed will be higher. However, it is also true [in California] that the Fast Lane will have higher flow.
It also makes sense that a slightly faster lane will move slightly more traffic (= will have larger flow). The disproportionally smaller flow in the slow lane is a result of a speed limit effect (see sidenote).
Now let’s assume congestion develops at a certain point in the road (because the road narrows, or even spontaneously).
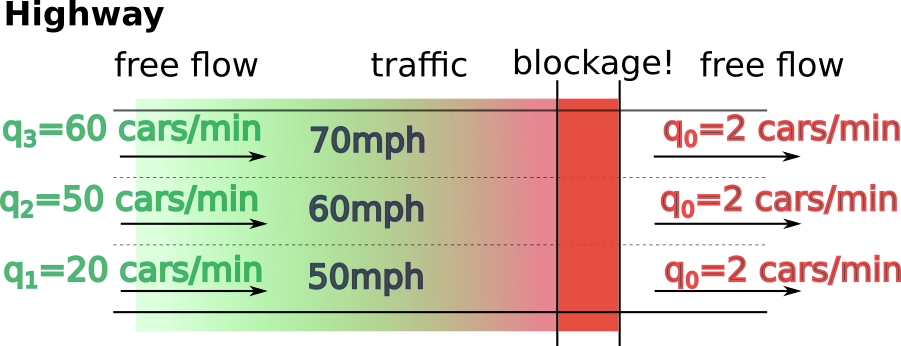
How many cars will get stuck in each lane (assuming no lane changes occur)? If n-th lane’s flow is $q$, then
the number of cars passing through would be their product $q\cdot T$. If the incoming flow is $q_n$ and
outgoing $q_0$, then the number of cars that enter the zone but do not get through the blockage per unit
of time $T$ would equal to:
$$(q_0 - q_n)\cdot T$$
It seems reasonable that lanes with the highest traffic flow will accummulate the most cars:
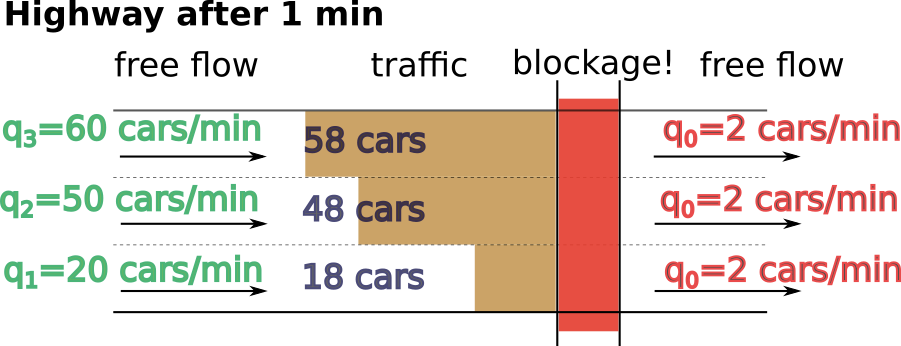
Indeed, more cars in the high-flow lane are entering the road before the congestions per unit of times than in the flow lanes. Therefore, the higher-flow lane will accummulate more cars.
Admittedly, this simple models ignores most of the long-term effects of the traffic. However, it does illustrate what I observe pretty much daily: Lanes with highest flow tend to develop longer congested segments than the lanes with lowest flow.
So a lesson from this could be: when you see congestion ahead, merge into the slow lane.
Another lesson from this: it’s sometimes beneficial to drive in a lane that has a high-flow exit. Consider the following situation:
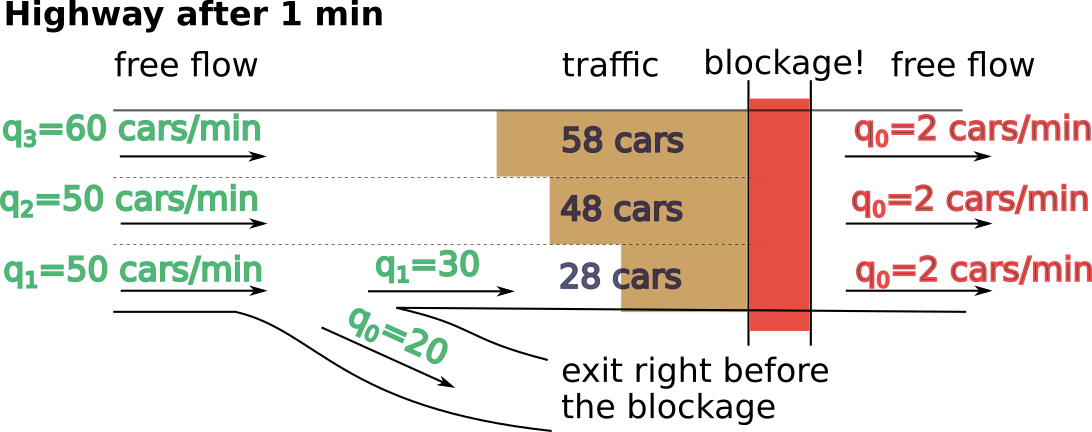
Here, the congestion in the first lane will be twice as small as in the other lanes, because the exit “unloaded” it.
This model stops scaling though
The effects described above will likely disintegrate after several minutes, thanks to lane changes. The distribution of the speeds, flow, and concentration will “diffuse” from the slowest lane into other lanes. I’ll devote a separate post to lane changes.
Other results of Traffic Modeling
Researchers have been studying traffic and the properties of traffic for as long as there were cars on the city roads. Basically, the models I read about focused on two areas:
-
“Car follower models” that infer macroscopic traffic flow properties from the behavior of individual driver decision-making.
-
“Traffic flow models” that study macroscopic traffic flow properties directly, and infer relationships between them.
Note that classical fluid dynamics models (of the kind that study the flow of water in the pipes) are not applicable to traffic flow. Despite that fluid dynamics studies similar properties “such as flow velocity, pressure, density, and temperature, as functions of space and time”, cars and molecules of the fluid behave differently. Most notably, cars don’t normally push one anther as they collide, so things like Bernoulli principle do not apply, and while liquid in a pipe under pressure accelerates at the bottleneck, car traffic decelerates.
Car follower models
Car follower models basically model behaviors of individial cars (how the drivers accelerate, break, change lanes, and generally “follow” one another”). For example, there’s Gipps model and Newell’s model. The diagrams like this show individual car tracks:

(Image from the “Traffic flow theory and modelling” chapter by Serge Hoogendoorn and Victor Knoop.)
To illustreate the point I made above, notice how this model simply has “overtaking” as if it has no other effects than a car passing a different car. However, on a congested freeway, there needs to also be space in the other lane for the car to move into it, and subsequently and optionally back into the original lane. So this particular model does not intend to describe lane changes (which is OK; it can have other uses).
However, some other models do. In fact, a system called TRANSIMS mentions that it models behavior on a freeway as a network of agents trying to maximize their uitility, and finds a Nash Equilibrium, which becomes the solution for the steady flow of traffic.
Traffic flow models
Early traffic flow models mostly focused on establishing the relationship between speed, density, and flow. For example, the following diagram could be used to predict, at what speed will the highway reach maximum capacity:
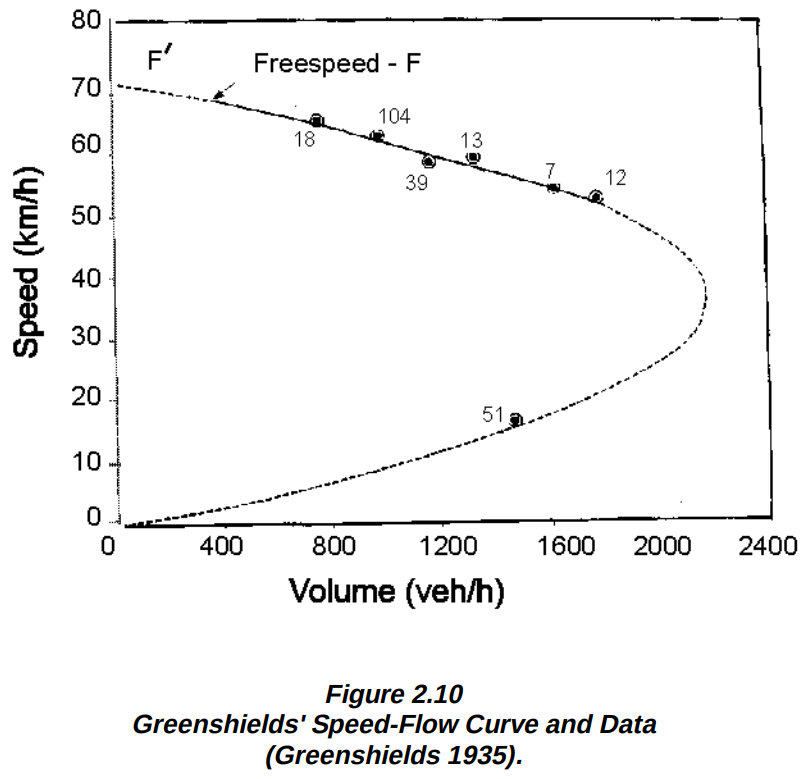
It’s reported that early traffic models did not explain spontaneous congestion on freeways (when trere’s traffic without any apparent reason). I guess all it took was for freeways to become spontaneously congested in the areas where the researchers worked. :-)
The discovery of spontaneous traffic breakdown by various people followed (in late 80s-late 90s), and the following law called “Fundamental diagram of traffic flow” was established: as the upstream traffic flow increases, speed downstream increases until it reaches the breaking point, at which both speed and the downstream flow start decreasing with continued increase of the upstream flow. It can be depicted on a neat three-dimensional diagram:
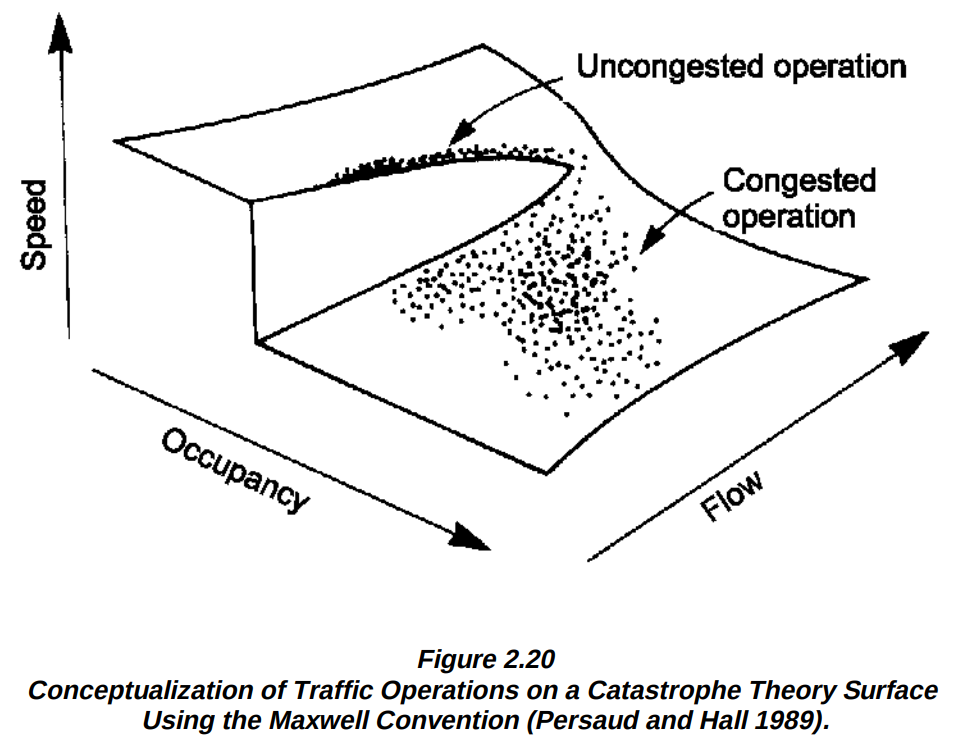
The diagram is borrowed from the “Traffic Stream Characteristics” by Fred L. Hall (pdf here).
My personal takeaway from this
While I’m not a traffic engineer, I set out to try to play with traffic simulations and try to see how I can model my daily commute. While revieweing the literature, it turned out that the field has amassed ample knowledge about highway traffic already, and there are existing open-source simulators (like TRANSIMS) that probably already do it better.
For example, the model I wanted to develop would be very similar to the “Cellular automata model” described on slide 24 in the slide deck by Benjamin Seibold (Temple University); known as Nagel-Steckenberg model.
However, I still wasn’t able to find any mention of traffic lane change models. They probably exist; please let me know if you find them!
So I think I’ll pull a plug on the simulation and move on to other things. However, I will muse about the lane change modeling and dynamics a bit in the next post, and also tell the story of the 101-92 interchange here.